

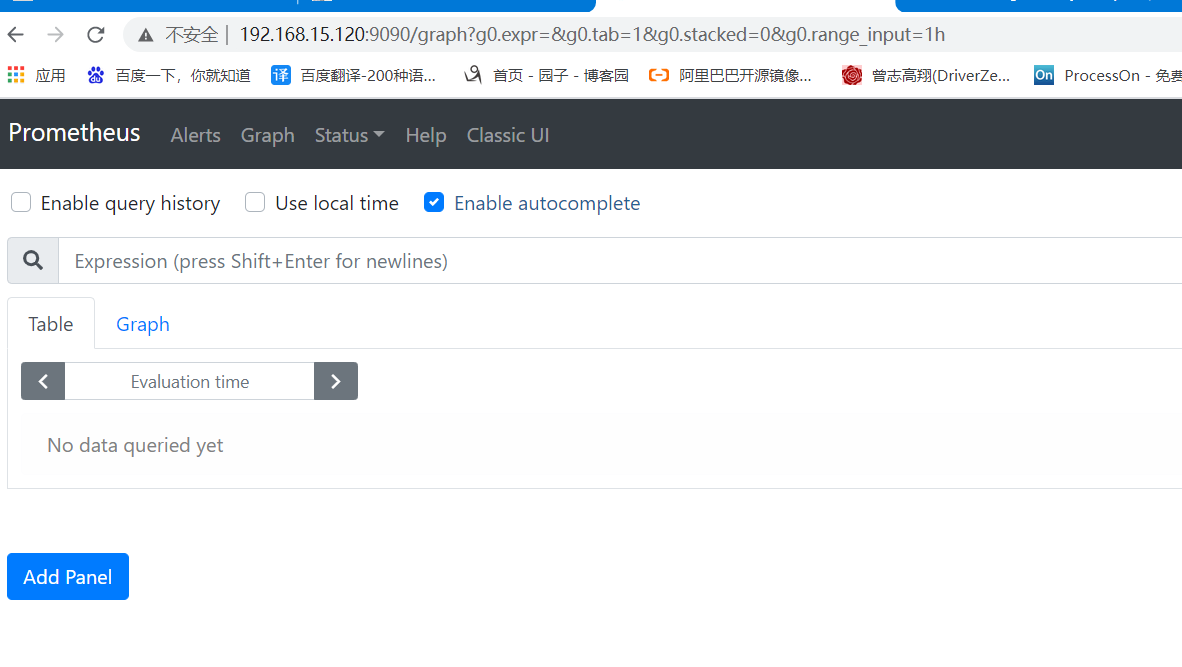
http://192.168.15.120:9090/
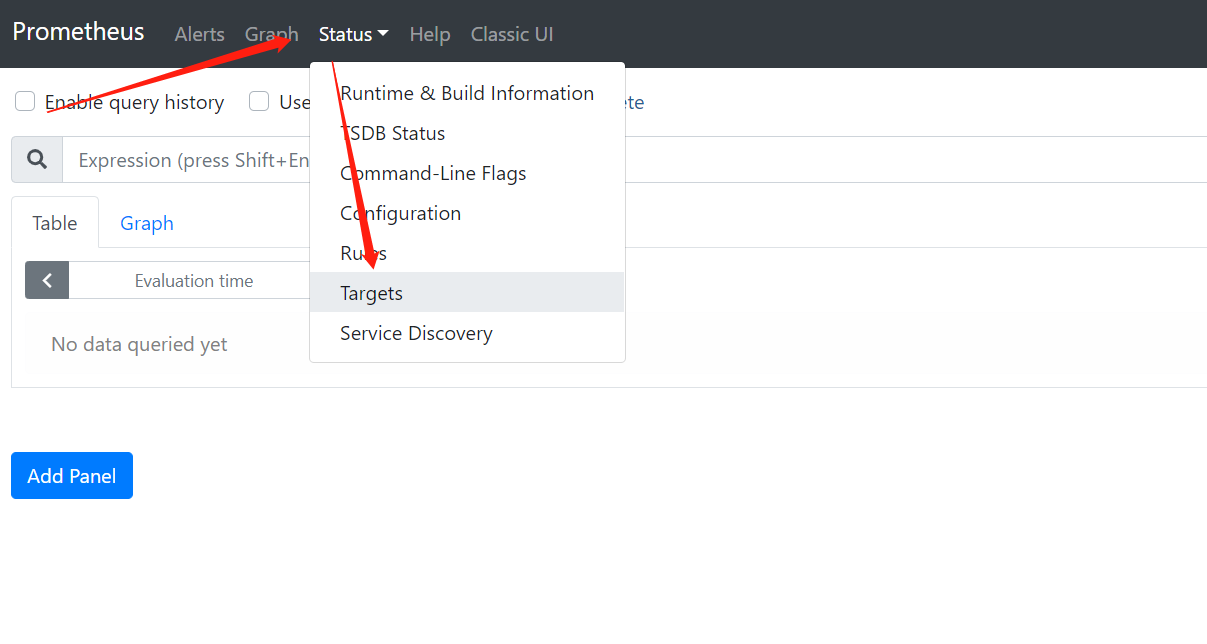
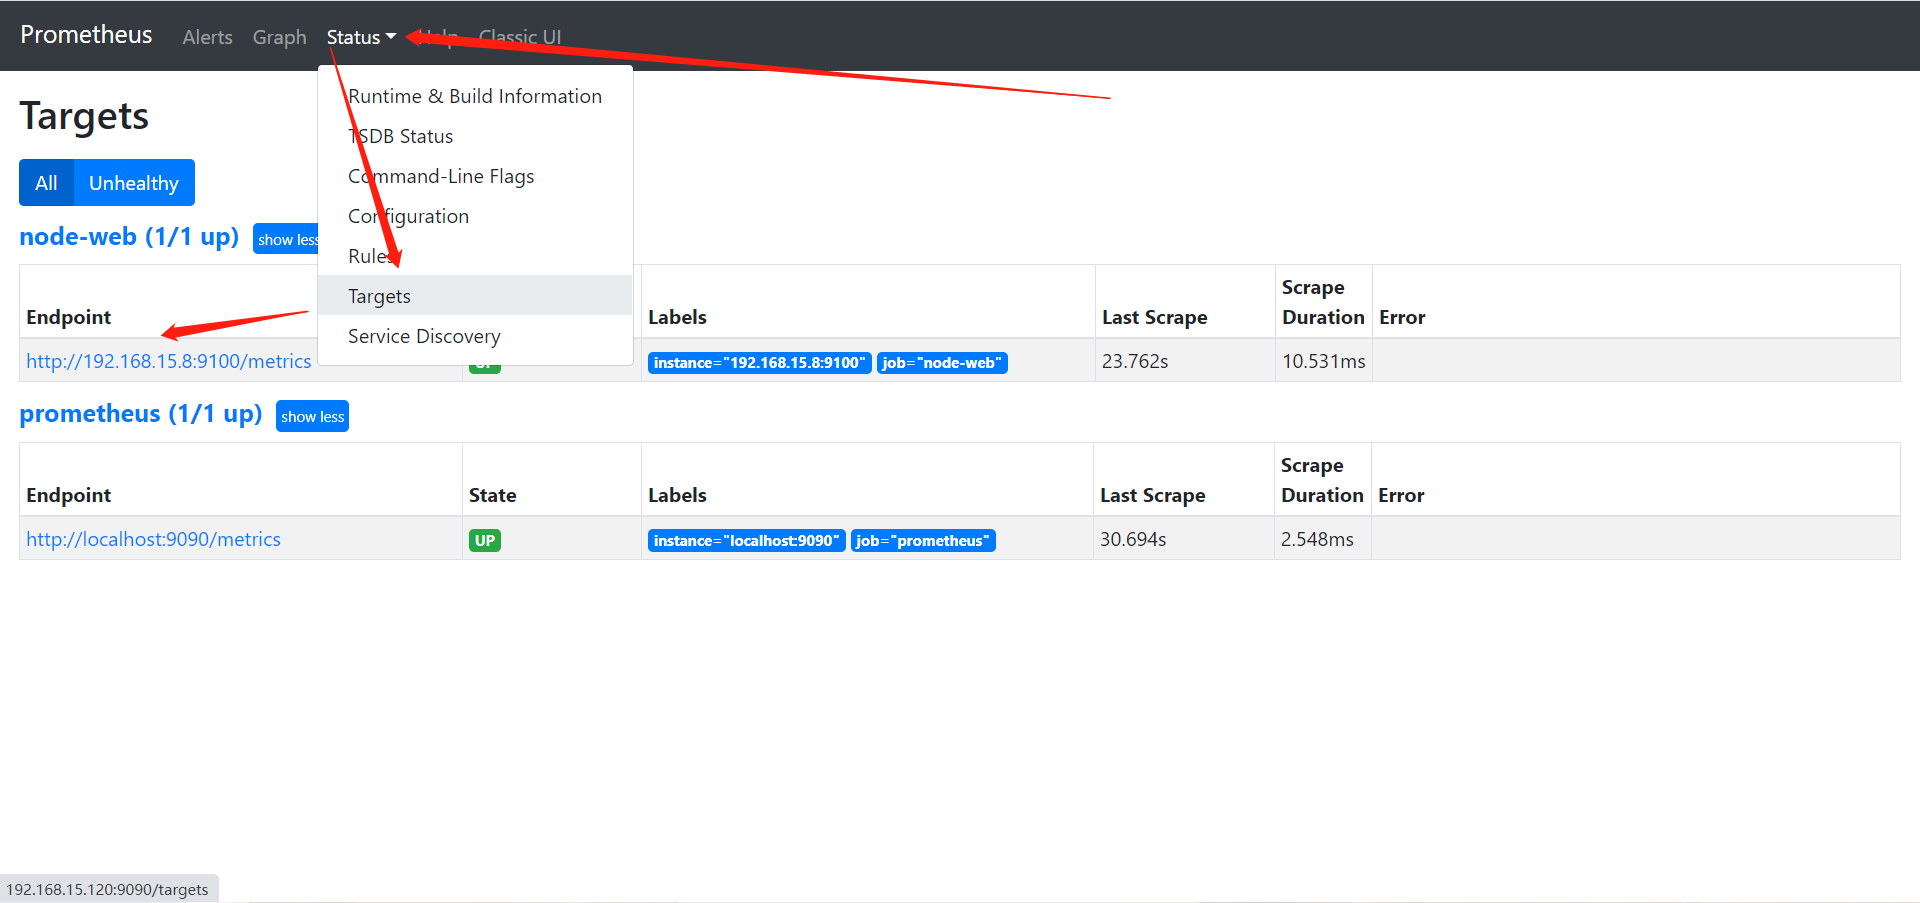
默认只监控了本机一台,点Status -->点Targets -->可以看到只监控了本机。
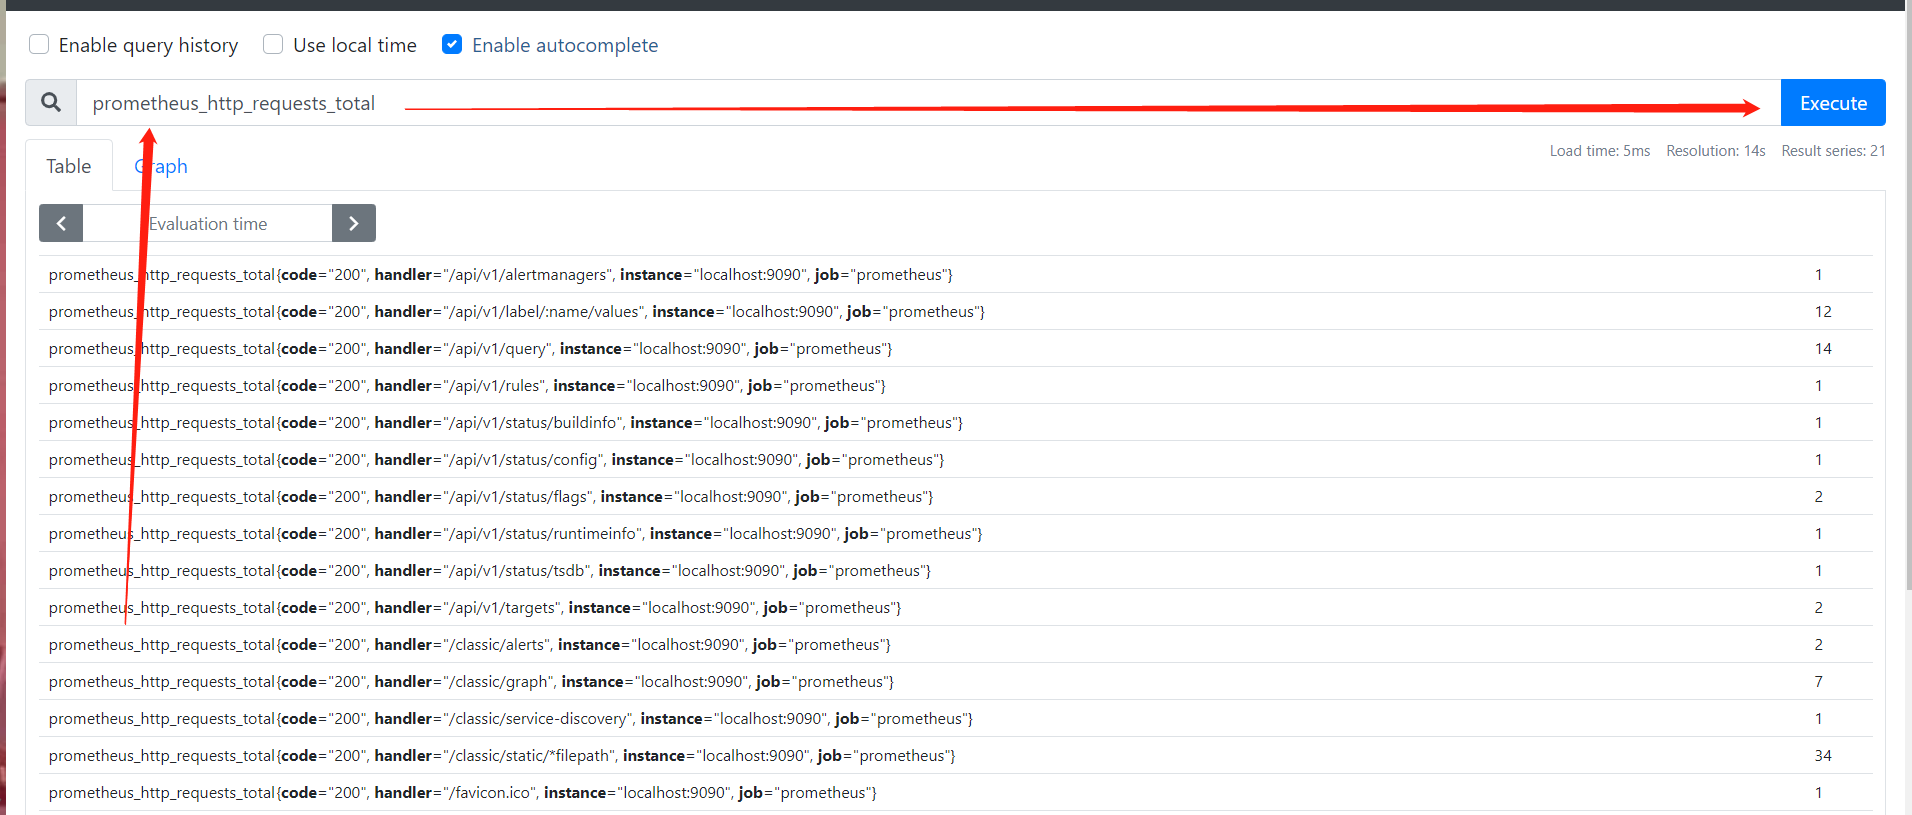
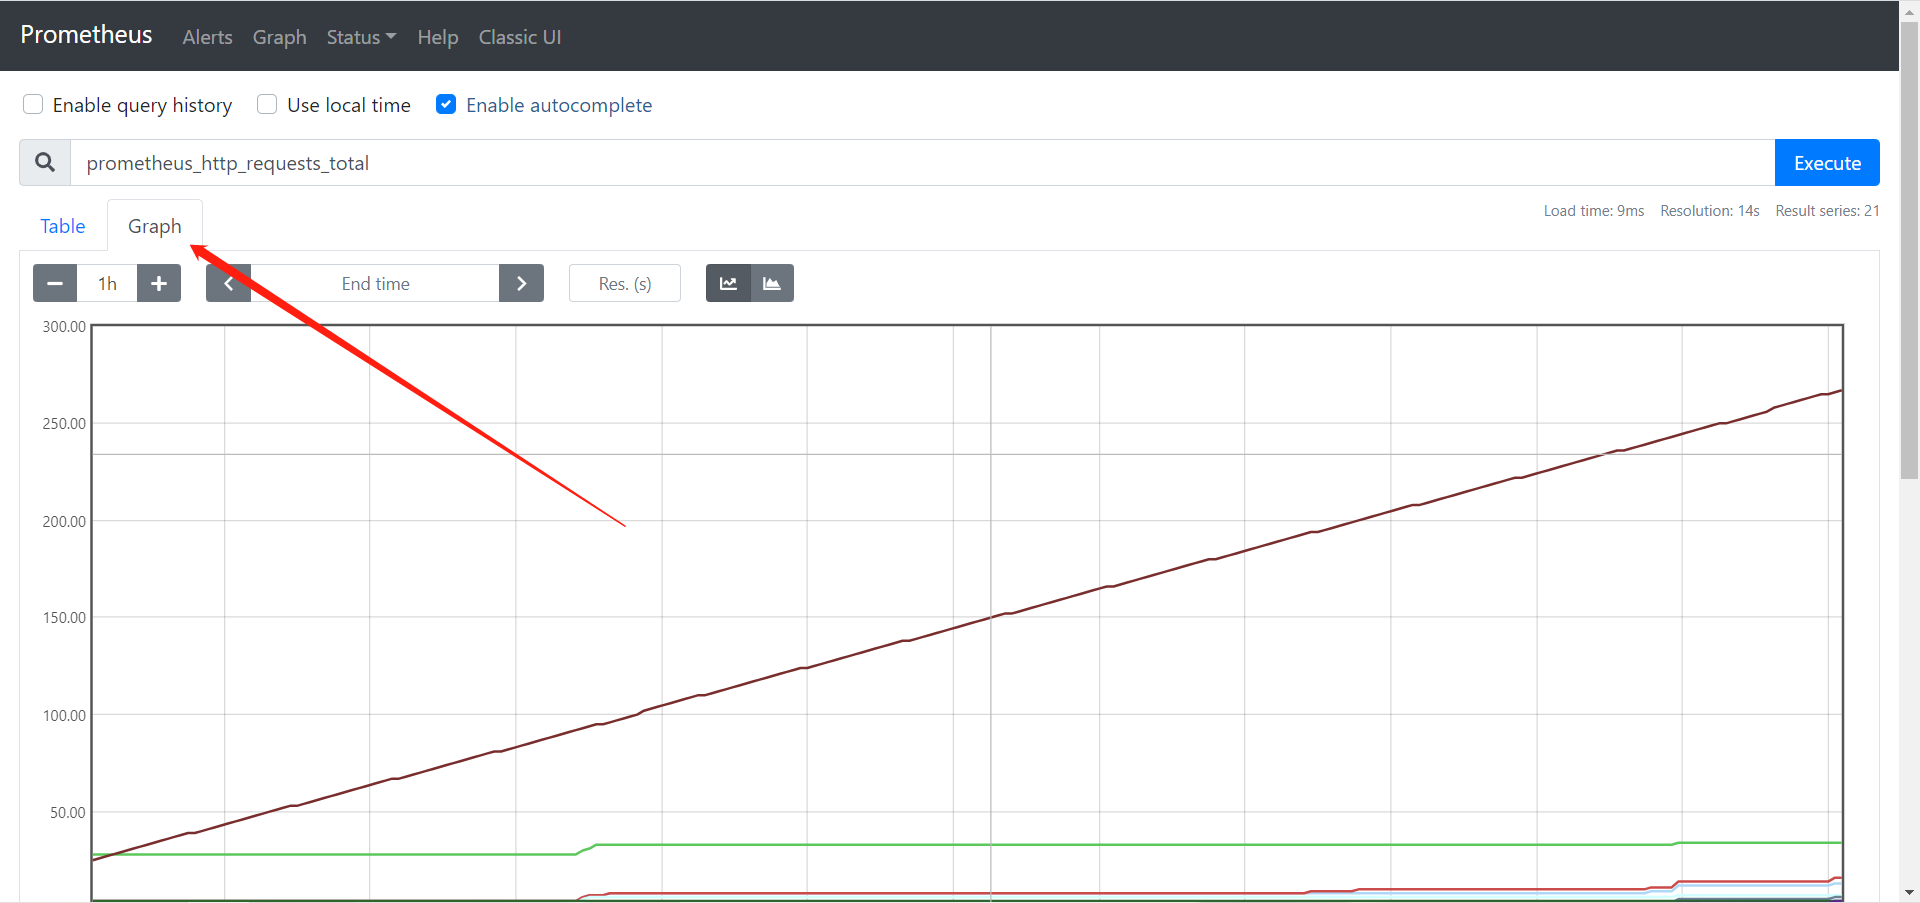
通过http://服务器IP:9090/metrics可以查看到监控的数据,在web主界面可以通过关键字查询监控项
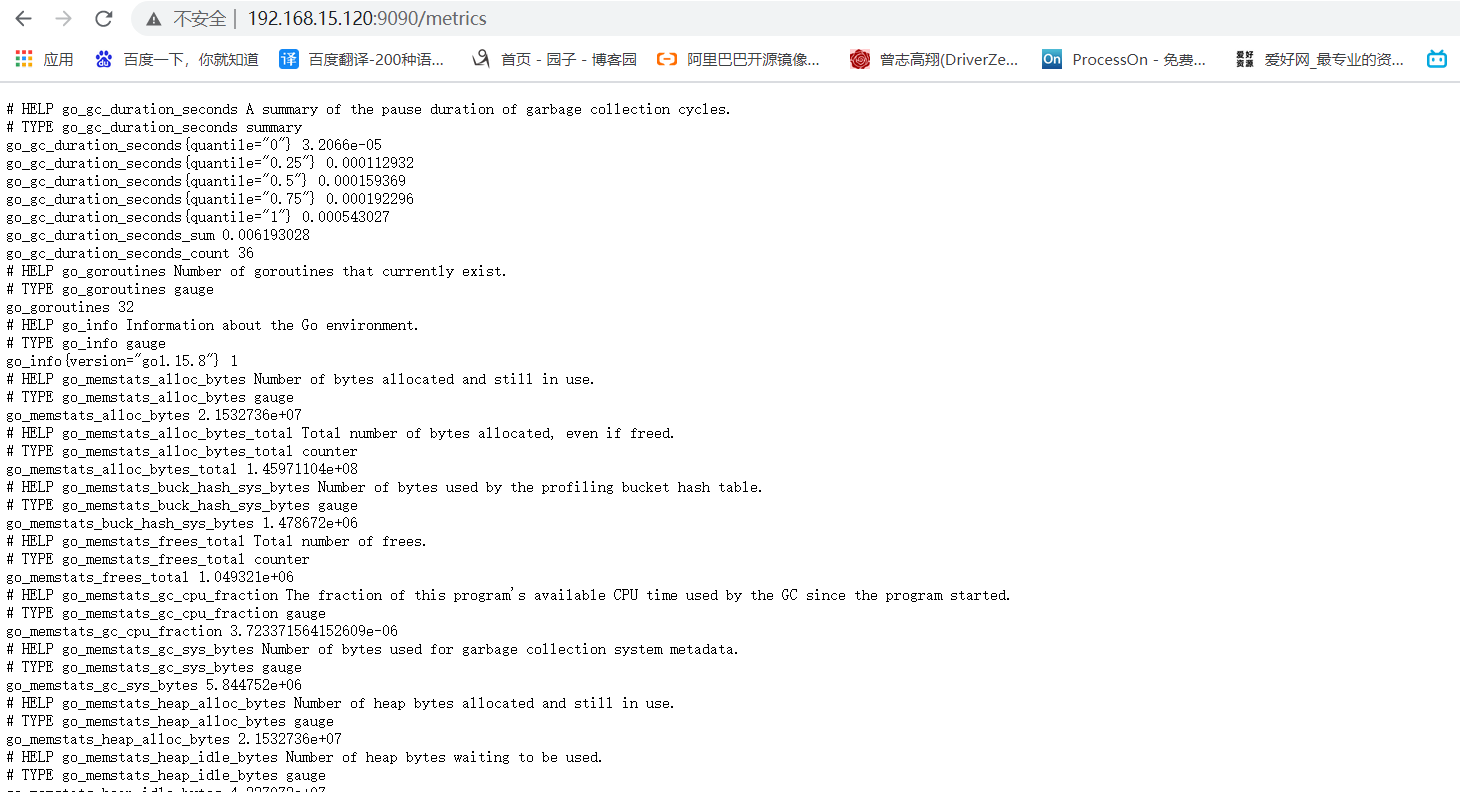
查看数据
查看图形
[root@web02 /opt]# wget https://github.com/prometheus/node_exporter/releases/download/v1.1.1/node_exporter-1.1.1.linux-amd64.tar.gz
[root@web02 /opt]# mkdir /prometheus_node/
[root@web02 /opt]# tar xf node_exporter-1.1.1.linux-amd64.tar.gz -C /prometheus_node/
[root@web02 /prometheus_node]# mv node_exporter-1.1.1.linux-amd64/* ./
[root@web02 /prometheus_node]# vim /usr/lib/systemd/system/node_exporter.service

[Unit]
Description=prometheus server daemon

[Service]
ExecStart=/prometheus_node/node_exporter
Restart=on-failure

[Install]
WantedBy=multi-user.target

# 重载
systemctl daemon-reload
[root@web02 ~]# systemctl enable node_exporter.service --now
[root@web02 ~]# netstat -lntup|grep 9100
tcp6       0      0 :::9100                 :::*                    LISTEN      3224/node_exporter
[root@web02 ~]# curl 127.0.0.1:9100/metrics
...
好多监控数据啊
...
[root@promethus /prometheus]# vim prometheus.yml
...
  - job_name: 'node-web'
    static_configs:
    - targets: ['192.168.15.8:9100']
[root@promethus /prometheus]# systemctl restart prometheus.service
http://IP:9100/metrics